views
- Windows blue screen errors create DMP files in C:\Windows\Minidump by default. The location varies if Windows is installed on a different drive.
- You can use WinDbg by Microsoft to open all types of .DMP files—not just those created by Windows memory or kernel errors.
- BlueScreenView is a free debugging tool that clearly highlights the software and drivers that were involved in the system crash.
Using WinDbg
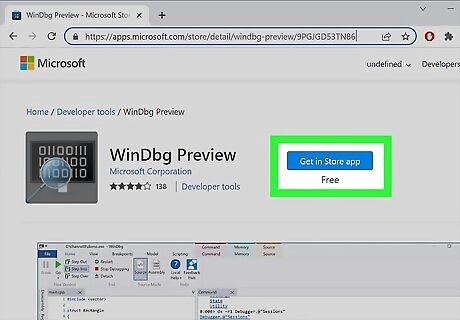
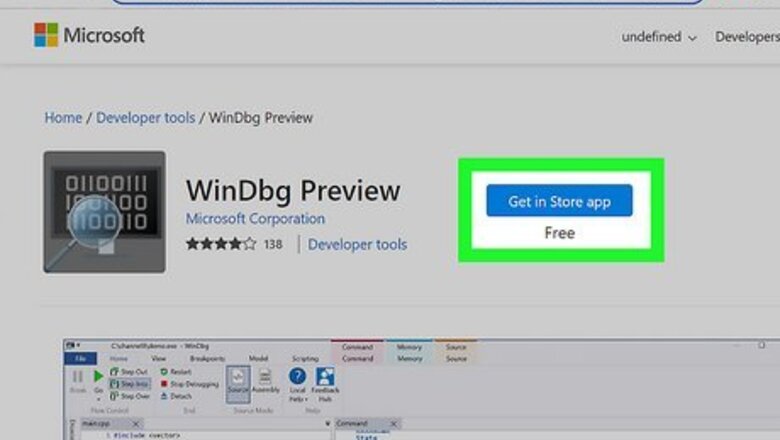
Install WinDbg from the Microsoft Store. This free debugging tool from Microsoft will help you analyze all types of dump (DMP) files, including memory dumps from blue screen errors. To download, go to https://apps.microsoft.com/store/detail/windbg-preview/9PGJGD53TN86, click Get in Store app, and click Install.
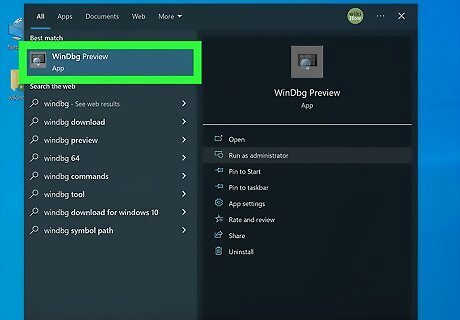
Open WinDbg as an administrator. If you want to analyze system-level dump files, you'll typically need administrator privileges. To run the app as an administrator: Press the Windows key and type windbg. Right-click WinDbg Preview and select Run as administrator. Click Yes to confirm.
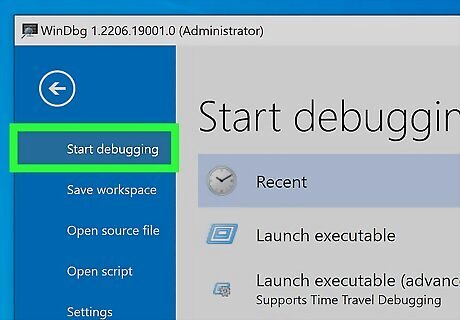
Click the File menu and select Start debugging. A list of debugging processes will appear.
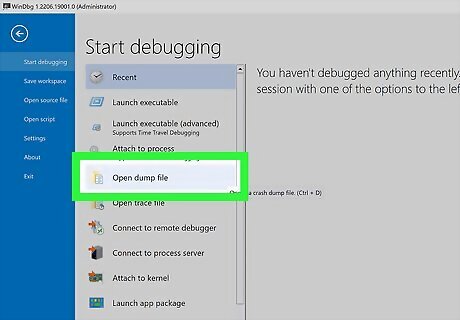
Select Open dump file. You'll see a "Supported file formats" area that displays a list of dump formats and file extensions you can debug with this tool, including: Windows user and kernel mode dump formats: DMP, HDMP, MDMP Windows binary image formats: EXE, DLL, SYS Linux user and kernel mode core dumps and binary formats: ELF, KDUMP macOS user mode core dumps and binary formats: MACHO
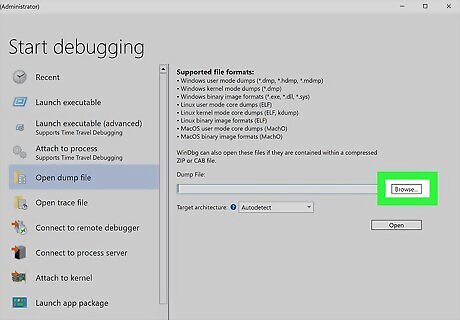
Click the Browse button and select a dump file. The location of your dump file will vary. You'll usually find it in C:\Windows\minidump. You can also select a compressed CAB or ZIP file that contains a dump file. No need to decompress it first. Minidump files are shorter versions of the dump files that are easier to open and analyze. They still contain all of the information you'll need to track down the error. If you're not sure where your dump files are saved by default, you can check the location in your advanced system settings.
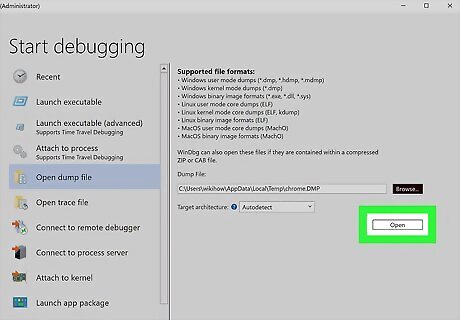
Click Open. WinDbg will now load the dump file in the analyzer. This might take a few moments depending on the size of the file.
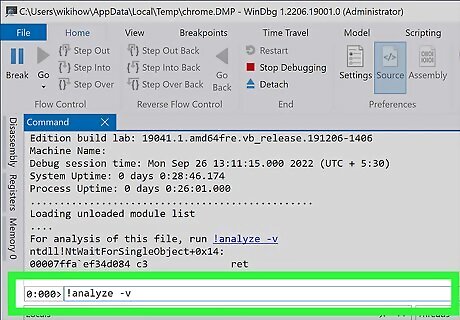
Type !analyze -v into the command line and press ↵ Enter. This command line is just below the body of the dump file. Running this command will analyze and display verbose information in the Command tab. This process might take some time, as dump files can be rather large. You'll know the analysis is complete when the progress bar is no longer moving.
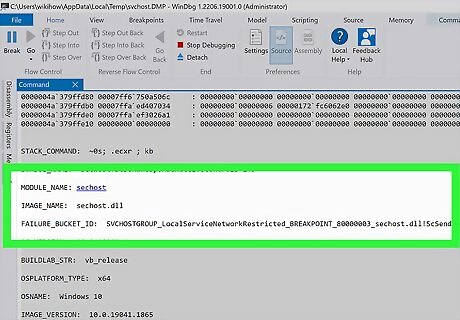
Look for errors in the Bugcheck Analysis area. Once the analysis is complete, you can scroll through the data to view information that can help you troubleshoot the crash. Sometimes you'll see a really clear description of what caused the dump or kernel panic, while other times the text might be kind of vague. It really depends on the type of dump file you're reading and what caused the issue. If you caught a blue screen error in the moment and remember the stop code (such as DRIVER_IRQL_NOT_LESS_OR_EQUAL, DPC_WATCHDOG_VIOLATION, or a hexadecimal code like0xC000000F), search the dump analysis for that string of text. You can also look for "MODULE_NAME" and "FAILURE_BUCKET_ID" in the analyzer to find the specific program or driver that caused the crash.
Using BlueScreenView
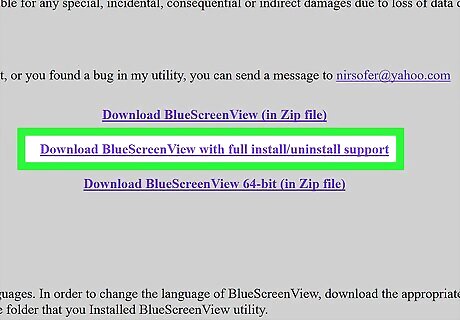
Download BlueScreenView by Nirsoft. This free utility makes it easy to open and analyze minidump files created by Windows blue screen crashes. You can download the tool from https://www.nirsoft.net/utils/blue_screen_view.html. To install BlueScreenView, click Download BlueScreenView with full install/uninstall support, double-click the downloaded bluescreenview_setup.exe file, and follow the on-screen instructions. If you don't want to install a program, you can download the standalone version by clicking the Download BlueScreenView (in Zip file) link. Then, just unzip the file to find a fully-usable version of the app that doesn't require installation.
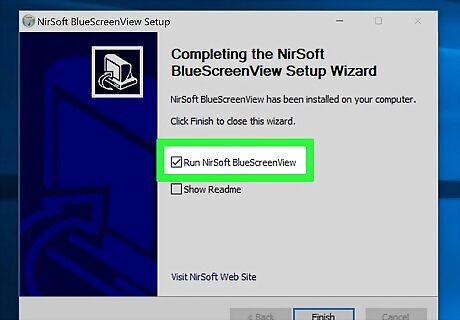
Open BlueScreenView. If you downloaded the standalone version of BlueScreenView, just double-click BlueScreenView.exe in the extracted folder. If you installed the app, you'll find BlueScreenView in your Start menu. If BlueScreenView detects a dump file (ending with DMP) in the default location of C:\Windows\MiniDump, it will display the dump file's name and date in the upper portion of the window.
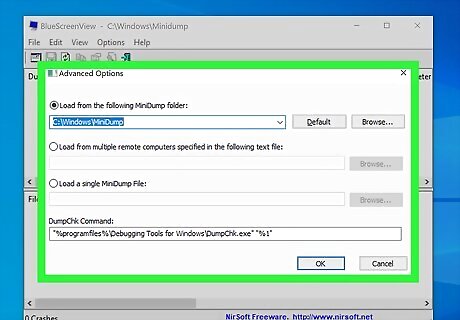
Select a dump file location (if needed). If you don't see the dump file you're looking for, you can change the location: Press Control + O on the keyboard to open the Advanced Options. Click Browse. Select the location of your dump file (such as C:\MiniDump}} and click OK. If you're not sure where your dump files are saved by default, you can check the location in your advanced system settings. Minidump files are shorter versions of the dump files that are easier to open and analyze. They still contain all of the information you'll need to track down the error.
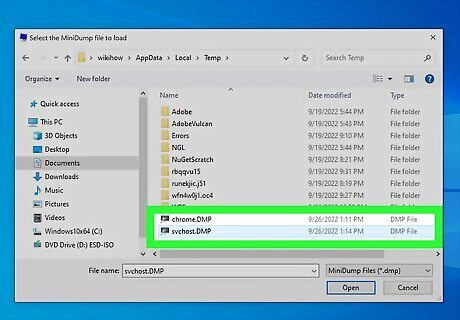
Select the dump file you want to analyze. The most recent dump file in the selected folder appears in the upper portion of the window. When you click the dump file, its details expand in the bottom panel.
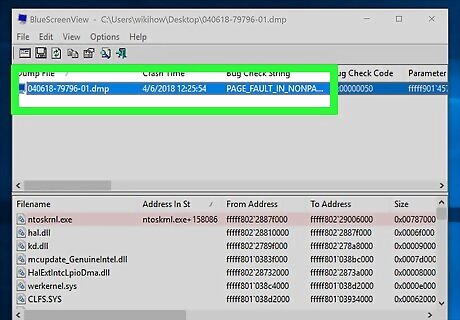
Read the dump file. You'll see the stop code for the dump (e.g., DRIVER_IRQL_NOT_LESS_OR_EQUAL} in the "Bug Check String" column in the top panel. In the bottom panel, you'll see the drivers and programs responsible for the crash highlighted in red.
Changing Memory Dump File Settings

Press the Windows key on your keyboard. If you need to view or change the location of your Windows system dump files, you can do so in your Advanced System Settings. Start by pressing the Windows key on your keyboard or clicking the magnifying glass on the taskbar. By default, your system dump files are automatically overwritten with each new crash. You can disable this automatic overwriting if you want to keep old dump files for analysis.
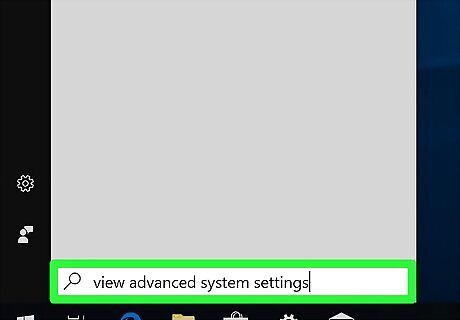
Type view advanced system settings. A list of search results will appear.
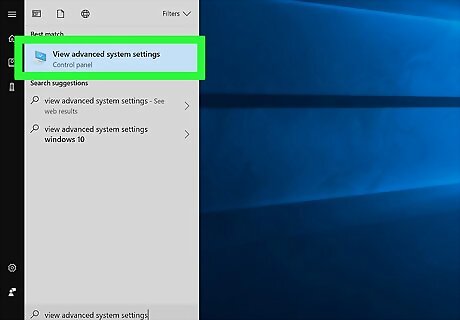
Click View advanced system settings. It's a computer monitor with a checkmark icon at the top of the Start menu. Doing so opens the Advanced System Settings window.
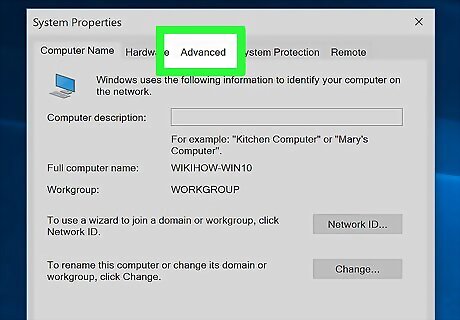
Click the Advanced tab. You'll see this at the top of the window.
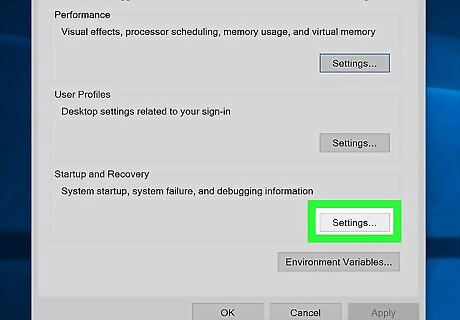
Click the Settings button. It's below the "Startup and Recovery" heading near the bottom of the page.
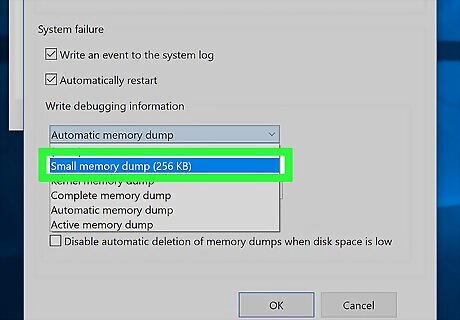
Select Small memory dump from the "Write debugging information" menu. Each item in this menu is a different type of Windows dump file that you can configure separately. For the dump file generated by a blue screen error, choose Small memory dump from the menu. EXPERT TIP Luigi Oppido Luigi Oppido Computer & Tech Specialist Luigi Oppido is the Owner and Operator of Pleasure Point Computers in Santa Cruz, California. Luigi has over 25 years of experience in general computer repair, data recovery, virus removal, and upgrades. He is also the host of the Computer Man Show! broadcasted on KSQD covering central California for over two years. Luigi Oppido Luigi Oppido Computer & Tech Specialist A memory dump file is a file that's taken from RAM. RAM has a number of allocation tables—or buckets—inside. A memory dump file is an entire download of whatever was inside that file when a catastrophic failure happened, and it goes into a log so an engineer or a software professional can look at it and see where the conflict happened.
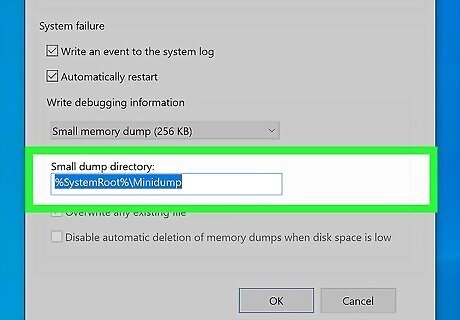
Find (or change) the location of this dump file. The dump file's location appears under the "Dump file" heading. If you see something like %SystemRoot%\Minidump, the &SystemRoot& part of the location is just a link to the root of your Windows installation (e.g., C:\Windows). So, if Windows is installed on your C drive and the dump file location is %SystemRoot%\Minidump, your dump files are saved to C:\Minidump.
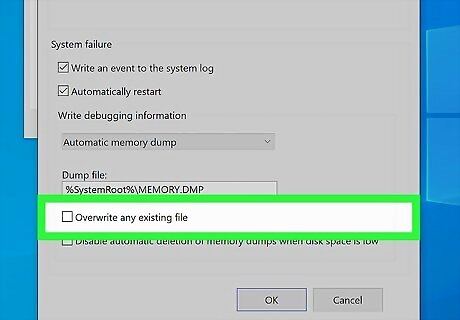
Choose what to do with old dump files when new crashes occur. For small memory dump files, older dumps are not overwritten. However, larger dump files (kernel memory dump, complete memory dump, automatic memory dump, and active memory dump) are automatically overwritten each time a new crash is logged. If you'd rather keep these old logs for analysis, select the log type, then remove the checkmark from "Overwrite any existing file." The complete memory dump file is the largest type of Windows dump file. If you're low on disk space and face a lot of crashes, you might want to overwrite these automatically to conserve space.
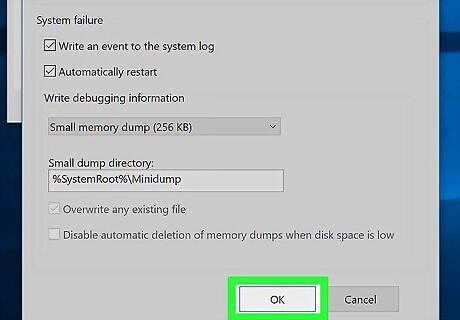
Click OK to save your changes. If you changed any of your dump file settings, this saves them permanently. You can then click OK again to exit Advanced System Settings.


Comments
0 comment